Visualizing National Worker Survey Data through Worker Health Charts
Posted on byAnne is the CEO of a major hospital in a large metropolitan area. She is concerned by reports the Human Resources Department is receiving from employees about harassment and bullying. She understands that harassment and bullying can create a hostile work environment. With these concerns in mind, she includes questions about hostile work environment in the hospital’s annual employee survey. Anne finds the National Institute for Occupational Safety and Health (NIOSH) interactive data visualization tool, called Worker Health Charts, and plans to compare results from the annual employee survey to national data available within this tool. Worker Health Charts allows users to examine trends in workplace injuries and exposures using national workplace safety and health data from various sources, including the National Health Interview Survey (NHIS). The NHIS collects data about health and working conditions directly from a nationally representative sample of adults. In addition to the core questions asked every year, the survey also collects supplemental data that address special issues. In 2015 and 2010, NIOSH sponsored a series of questions added to the NHIS that were related to the impacts of work on health. Topics covered by the 2015 supplemental questions included:
- Low back pain
- Carpal tunnel syndrome
- Workplace health promotion programs
- General occupational exposures
- Work organization characteristics
- Psychosocial occupational exposures
The NHIS provides relevant data within Worker Health Charts to answer Anne’s questions on bullying and harassment.
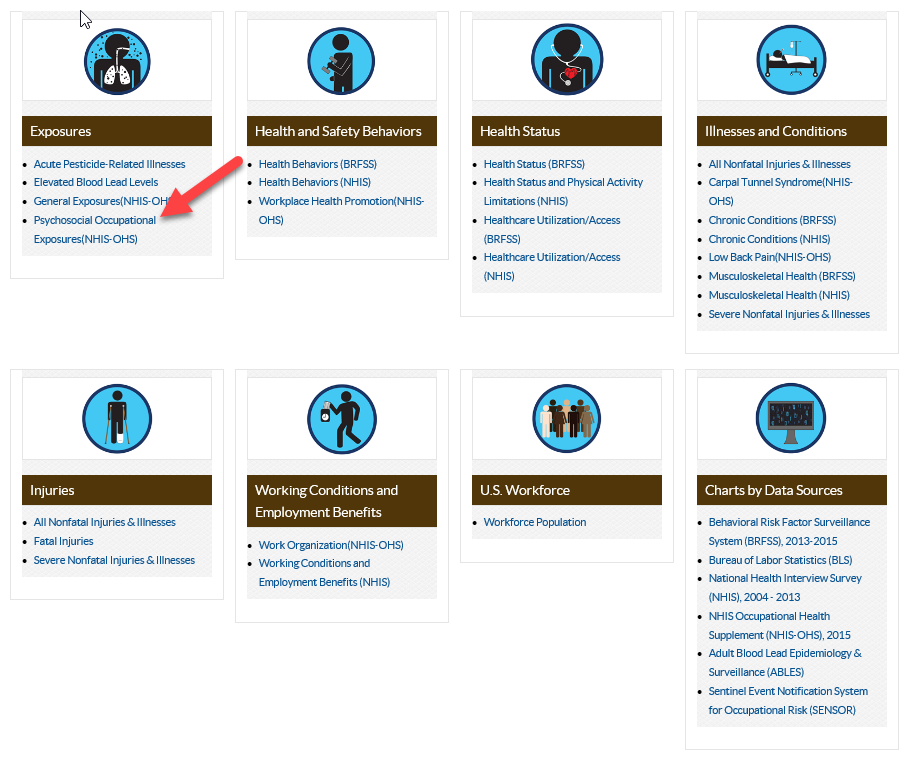
Anne locates the Worker Health Charts home page, and scrolls down to find a menu summarizing the topics for which data are available. Anne thinks that “hostile work environment” might fall under “Exposures”, and more specifically, “Psychosocial Occupational Exposures”, so she clicks on that link.
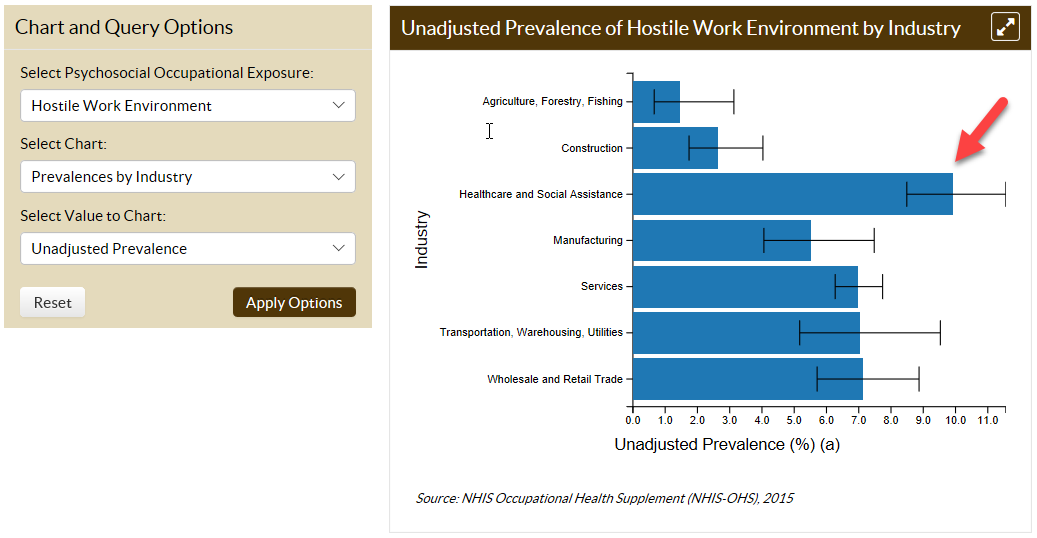
Anne sees that she can chart the prevalence of “Hostile Work Environment”, which is an option under “Select Psychosocial Occupational Exposure”. Because she’s interested in the national data for the hospital industry, she chooses “Prevalences by Industry”.
She clicks on “Healthcare and Social Assistance” to see if more detailed information is available.
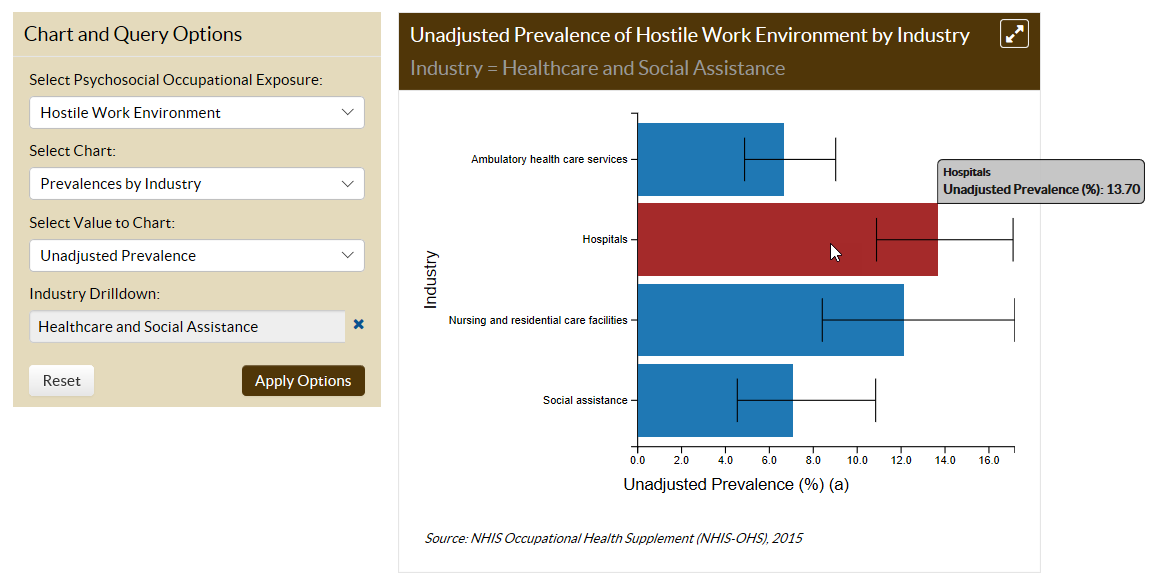
Anne sees that, nationwide, approximately 14% of workers employed in hospitals report exposure to a hostile work environment, which is lower than what was found in the hospital’s annual employee survey. Anne decides to take action to provide a better work environment for her employees.
The Worker Health Charts helped her clarify that there is a problem within her hospital. She wonders whether NIOSH has any free resources available for addressing this problem, so she searches around on the NIOSH website and finds a relevant topic page about Occupational Violence which includes an online workplace violence prevention course for nurses.
This is just one example of how NHIS data and Worker Health Charts can be used. Whether you are a health and safety professional, researcher, or manager looking to resolve workplace safety and health problems, the NHIS data visualized through Worker Health Charts provides useful information that is easily accessible.
We invite you to explore the NHIS data available within the Worker Health Charts. What interesting findings are you seeing related to your job or industry? What information is missing that you would like to see? Provide your feedback below!
For more guidance in how to use Worker Health Charts, refer to this step-by-step blog.
Also see the recent CDC Features article “How job-related data benefits you.”
Blair Carlin was a 2018 NIOSH summer intern and is working toward degrees in Global Health and Communications at DePauw University (2019).
CAPT Sara E. Luckhaupt, MD, MPH, is a Team Leader in the NIOSH Division of Surveillance, Hazard Evaluations, & Field Studies.
Amy Mobley, MEn, is a Health Communications Specialist in NIOSH Division of Surveillance, Hazard Evaluations & Field Studies.
Post a Comment